Detecting global financial crises over history: A Multivariate NonLinear Denoising Strategy
Goal. The digital humanity project proposed here aims to provide an original tool for the detection of global financial crises over history.
Context and contributions. For long, the detection of global financial crisis over history has been based on (human) expert assessment, calling for updates on a regular basis. Further, model-based detections were proposed that often rely on the analysis of a single time series consisting of an aggregated crisis index.
Aiming to contribute to the generic goal of designing statistical signal processing tools to assist in economics and politics decision making, we promote the use of an original and recently defined multivariate nonlinear denoising procedure (formulated as an inverse problem and solved by nonsmooth convex optimization) for the detection of global financial crisis over history.
Methodogy. An original 3-step financial crisis detection is proposed.
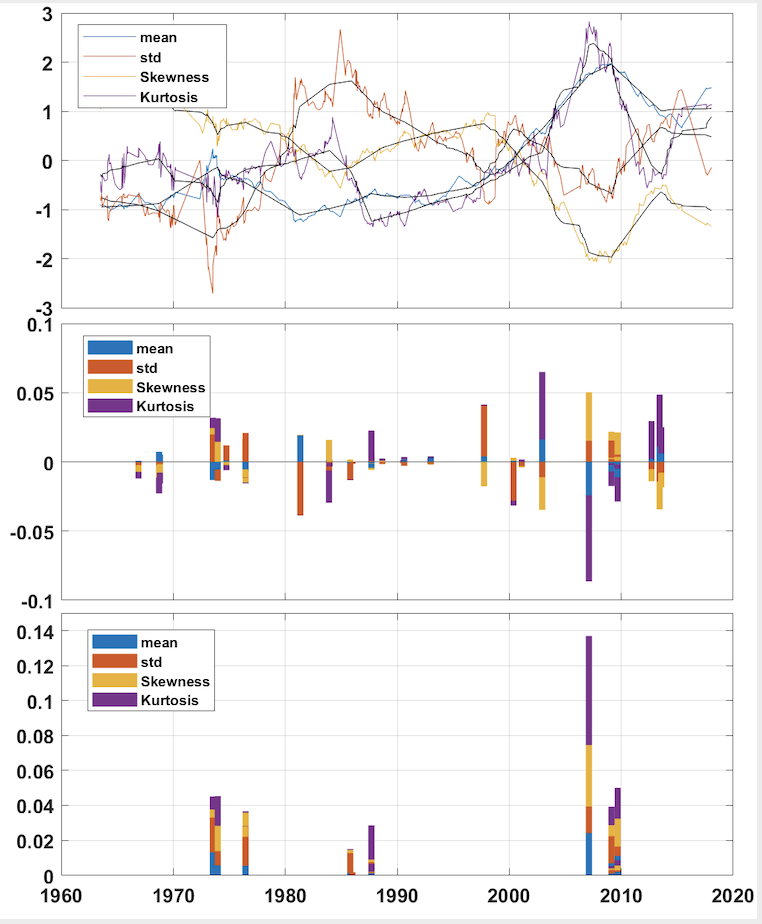
- Step1 consists in extracting multiple time series indices conveying relevant informational content from the sliding-window correlation structure of the data ;
- Step2 performs a nonlinear piecewise linear denoising of the evolution along time of these multivariate indices. Change points correspond to potential crisis markers. This optimization-based inverse-problem denoising tool is fully detailed here. This video shows nonlinear piecewise linear denoising in action.
-
Step3 achieves crisis detection and typology by analyzing and combining the values of the multivariate indices at the marked change points.
These 3 steps are illustrated at work in Figure 1 below and here.
Data. The proposed tool is applied to Equity Market (monthly) prices for 40 years and jointly for 32 countries worldwide.
Outcomes.
- The proposed tool is shown to detect and dates all major global financial crises [1973, 1976, 1987, 2007, 2009, 2010].
- The examination of the values of the multivariate indices at the marked change points permits to establish a typology of the crisis based on geographical extension, duration, resolution, sectoral dimension.
- Applied jointly the 32 volatility time series, the proposed tool also permits to detect volatility change based crises, characterized by global spillover effects of the debt and currency crises of developing countries.
Perspective. This tool can be applied generically to any set of multivariate time series conveying quantitative financial information.
More information.
- An extended abstract of the contribution is available here.
- The “optimization-based piecewise smooth denoising toolbox” (digital content of the contribution) is documented here and available there.
- Slides describing the goal, the tool and the results are available here.
- A 4-page slide graphical abstract is available here.
Research team within the « Cliometrics et Complexity » project (http://www.ixxi.fr/equipes/cliometrie-et-complexite)
Cécile Bastidon (1,2) , Antoine Parent (1,3) , Pierre Borgnat (1,4), pablo Jensen (1,4), Patrice Abry (1,4), Barbara Pascal (1,5)
(1) Institut rhône-alpin des Systèmes Complexes
(2) LEAD, Université de Toulon, France,
(3) LED, Université Paris 8, & OFCE, France
(4) CNRS, ENS de Lyon, Laboratoire de Physique, Lyon, France
(5) CNRS, Université de Lille, France
bastidon@univ-tln.fr, patrice.abry, pierre.borgnat,pablo.jensen, barbara.pascal@univ-lille.fr, antoine.parent@sciencespo.fr